File list
This special page shows all uploaded files.
First page |
Previous page |
Next page |
Last page |
| Date | Name | Thumbnail | Size | User | Description | Versions |
|---|---|---|---|---|---|---|
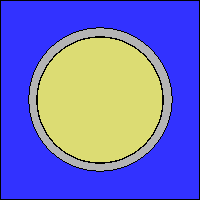
| 13:05, 12 September 2017 | TutorialPin geom3.png (file) |  |
1 KB | Ville Valtavirta | xz-plot of the tutorial pin-cell geometry. | 1 |
| 16:46, 14 September 2017 | TutorialReactorStep1.png (file) |  |
1 KB | Ville Valtavirta | Plot from the initial reactor input (infinite water geometry). | 1 |
| 18:14, 14 September 2017 | TutorialReactorStep4xz.png (file) |  |
1 KB | Ville Valtavirta | XZ-plot from the fuel rod model for the reactor input. | 1 |
| 17:27, 14 September 2017 | TutorialReactorStep2xz.png (file) |  |
1 KB | Ville Valtavirta | XZ-plot from the reactor input with radial structure. | 1 |
| 17:40, 14 September 2017 | TutorialReactorStep3xz.png (file) |  |
1 KB | Ville Valtavirta | XZ-plot from the reactor input with radial structure and axial limits. | 1 |
| 15:24, 24 February 2016 | IFC 2 axial density.png (file) |  |
1 KB | Ville Valtavirta | Coolant density of a pin-cell geometry adjusted using the regular mesh based interface in the axial direction. | 1 |
| 18:13, 14 September 2017 | TutorialReactorStep4xy.png (file) |  |
2 KB | Ville Valtavirta | XY-plot from the fuel rod model for the reactor input. | 1 |
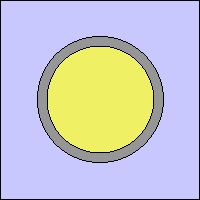
| 13:04, 12 September 2017 | TutorialPin geom1.png (file) |  |
2 KB | Ville Valtavirta | xy-plot of the tutorial pin-cell geometry. | 1 |
| 13:19, 12 September 2017 | TutorialColorPin geom1.png (file) |  |
2 KB | Ville Valtavirta | xy-plot of the tutorial pin-cell geometry. The material colors are now defined using the rgb-card for material definitions. | 1 |
| 17:48, 22 September 2016 | StaticCR.png (file) |  |
2 KB | Ville Valtavirta | Initial condition for the moving control rod example. | 1 |
| 17:26, 14 September 2017 | TutorialReactorStep2xy.png (file) |  |
2 KB | Ville Valtavirta | XY-plot from the reactor input with radial structure. | 1 |
| 17:39, 14 September 2017 | TutorialReactorStep3xy.png (file) |  |
2 KB | Ville Valtavirta | XY-plot from the reactor input with radial structure and axial limits. | 1 |
| 15:17, 24 February 2016 | IFC 1 1D axial density.png (file) |  |
2 KB | Ville Valtavirta | Reduced file size. | 1 |
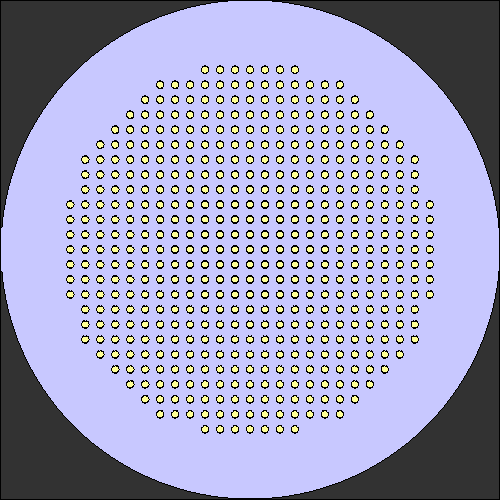
| 11:57, 29 September 2017 | Unstable3Dpin geom1.png (file) |  |
2 KB | Ville Valtavirta | XY-geometry plot of the pin-cell geometry used in the unstable 3D burnup problem. | 1 |
| 15:12, 25 February 2016 | Refl3Df.png (file) |  |
2 KB | Jaakko Leppänen | 2 | |
| 13:25, 25 February 2016 | Vacu2D.png (file) |  |
2 KB | Jaakko Leppänen | 1 | |
| 09:48, 5 October 2019 | VR Crit geom1.png (file) |  |
2 KB | Jaakko Leppänen | 1 | |
| 15:26, 25 February 2016 | Refl3Di.png (file) |  |
2 KB | Jaakko Leppänen | 1 | |
| 10:03, 5 October 2019 | VR Gvr geom1 vr0.png (file) |  |
3 KB | Jaakko Leppänen | 1 | |
| 20:59, 14 September 2017 | TutorialReactorStep5xz.png (file) |  |
3 KB | Ville Valtavirta | XZ-plot from the fuel rod lattice for the reactor input. | 1 |
| 15:48, 24 February 2016 | IFC 3 axial density.png (file) |  |
3 KB | Ville Valtavirta | Coolant density of a pin-cell geometry adjusted using the user defined functional dependence interface in the axial direction. (Sine wave functional dependence) | 1 |
| 10:34, 5 October 2019 | VR Gvr geom1 vr1.png (file) |  |
3 KB | Jaakko Leppänen | 2 | |
| 21:12, 14 September 2017 | TutorialReactorStep6xz.png (file) |  |
3 KB | Ville Valtavirta | XZ-plot from the reactor core. | 1 |
| 22:31, 14 September 2017 | TutorialReactorStep9xzCR.png (file) |  |
3 KB | Ville Valtavirta | XZ-plot from the reactor core (level of control rods). | 1 |
| 22:48, 14 September 2017 | TutorialReactorStep10xzCR.png (file) |  |
3 KB | Ville Valtavirta | XZ-plot from the reactor core (level of control rods). | 1 |
| 22:56, 14 September 2017 | TutorialReactorStep11xzCR.png (file) |  |
3 KB | Ville Valtavirta | XZ-plot from the reactor core (level of control rods). | 1 |
| 10:34, 5 October 2019 | VR Gvr geom1 vr2.png (file) |  |
3 KB | Jaakko Leppänen | 2 | |
| 13:25, 25 February 2016 | Peri2D.png (file) |  |
3 KB | Jaakko Leppänen | 1 | |
| 13:25, 25 February 2016 | Refl2D.png (file) |  |
3 KB | Jaakko Leppänen | 1 | |
| 10:35, 5 October 2019 | VR Gvr geom1 vr3.png (file) |  |
3 KB | Jaakko Leppänen | 2 | |
| 10:35, 5 October 2019 | VR Gvr geom1 vr4.png (file) |  |
3 KB | Jaakko Leppänen | 2 | |
| 10:36, 5 October 2019 | VR Gvr geom1 vr5.png (file) |  |
3 KB | Jaakko Leppänen | 2 | |
| 20:58, 14 September 2017 | TutorialReactorStep5xy2.png (file) |  |
4 KB | Ville Valtavirta | XY-plot from the fuel rod lattice for the reactor input (level of lower grid). | 1 |
| 16:09, 3 October 2016 | HexIFC geom2.png (file) |  |
4 KB | Ville Valtavirta | Geometry plot from regular mesh hexagonal interface example. | 1 |
| 12:34, 8 March 2018 | HexIFC2 geom2.png (file) |  |
4 KB | Ville Valtavirta | 1 | |
| 20:58, 14 September 2017 | TutorialReactorStep5xy.png (file) |  |
4 KB | Ville Valtavirta | XY-plot from the fuel rod lattice for the reactor input (level of axial midplane). | 1 |
| 12:12, 3 November 2017 | CoupledTransientPlotXY.png (file) | 4 KB | Ville Valtavirta | XY-plot of the geometry of the coupled transient tutorial. | 1 | |
| 15:12, 4 October 2019 | VR Ref geom1.png (file) |  |
4 KB | Jaakko Leppänen | 1 | |
| 18:39, 24 February 2016 | Cross1.png (file) |  |
5 KB | Jaakko Leppänen | 2 | |
| 21:10, 14 September 2017 | TutorialReactorStep6xy.png (file) |  |
5 KB | Ville Valtavirta | XY-plot for the reactor input (level of axial midplane). | 1 |
| 17:21, 4 October 2019 | VR Ada1 geom1 vr0.png (file) |  |
5 KB | Jaakko Leppänen | 1 | |
| 22:16, 8 March 2016 | Directions large.png (file) |  |
5 KB | Jaakko Leppänen | 2 | |
| 13:01, 28 February 2016 | Sym 120615 bwr1.png (file) |  |
5 KB | Jaakko Leppänen | 2 | |
| 21:41, 14 September 2017 | TutorialReactorStep7corexy.png (file) |  |
5 KB | Ville Valtavirta | XY-plot from the reactor core after adding empty positions (level of axial midplane). | 1 |
| 21:17, 14 September 2017 | TutorialReactorEmptyLatticePos.png (file) | 5 KB | Ville Valtavirta | XZ-plot for an empty lattice position in the reactor tutorial. | 1 | |
| 22:16, 14 September 2017 | TutorialReactorEmptyGuideTube.png (file) | 5 KB | Ville Valtavirta | XZ-plot for an empty guide tube in the reactor tutorial. | 1 | |
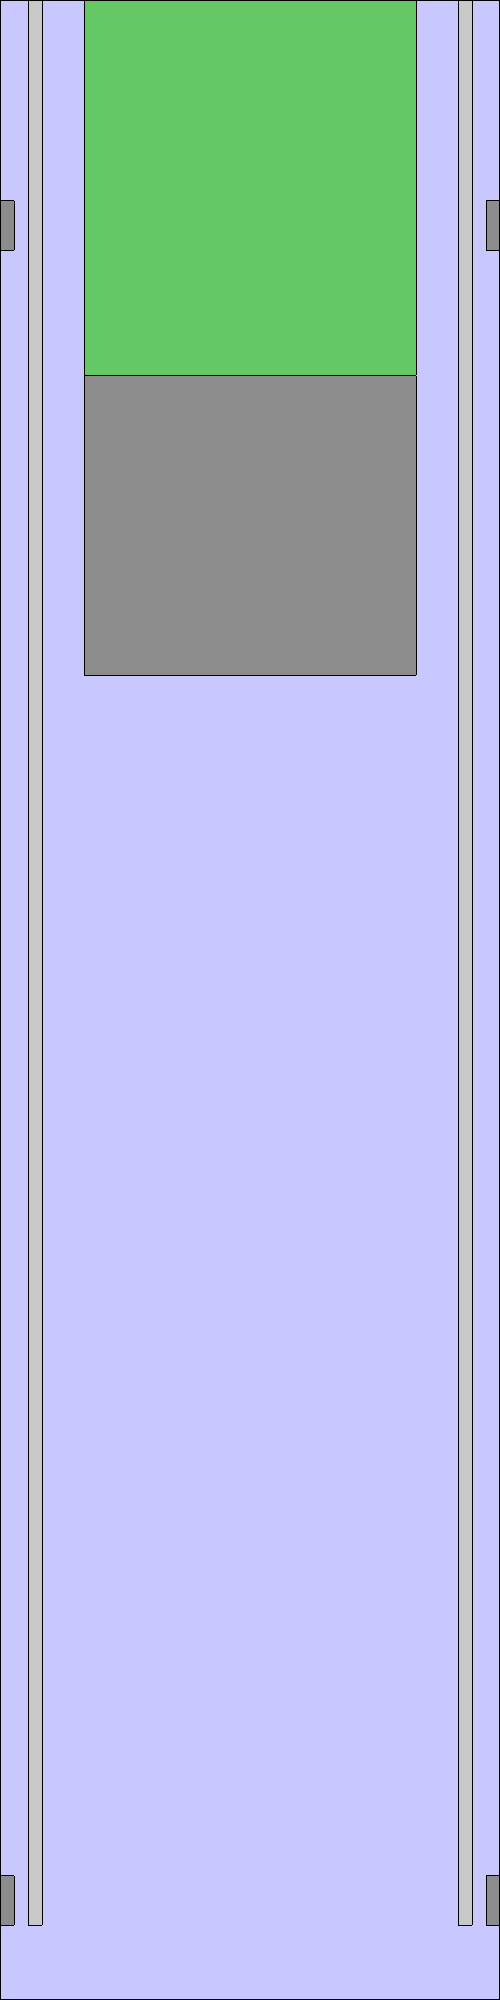
| 14:50, 14 September 2017 | TutorialReactorWithdrawnControlrodXZ.png (file) |  |
5 KB | Ville Valtavirta | xz-plot of the control rod and guide tube geometry model for the tutorial research reactor. Fully withdrawn. | 1 |
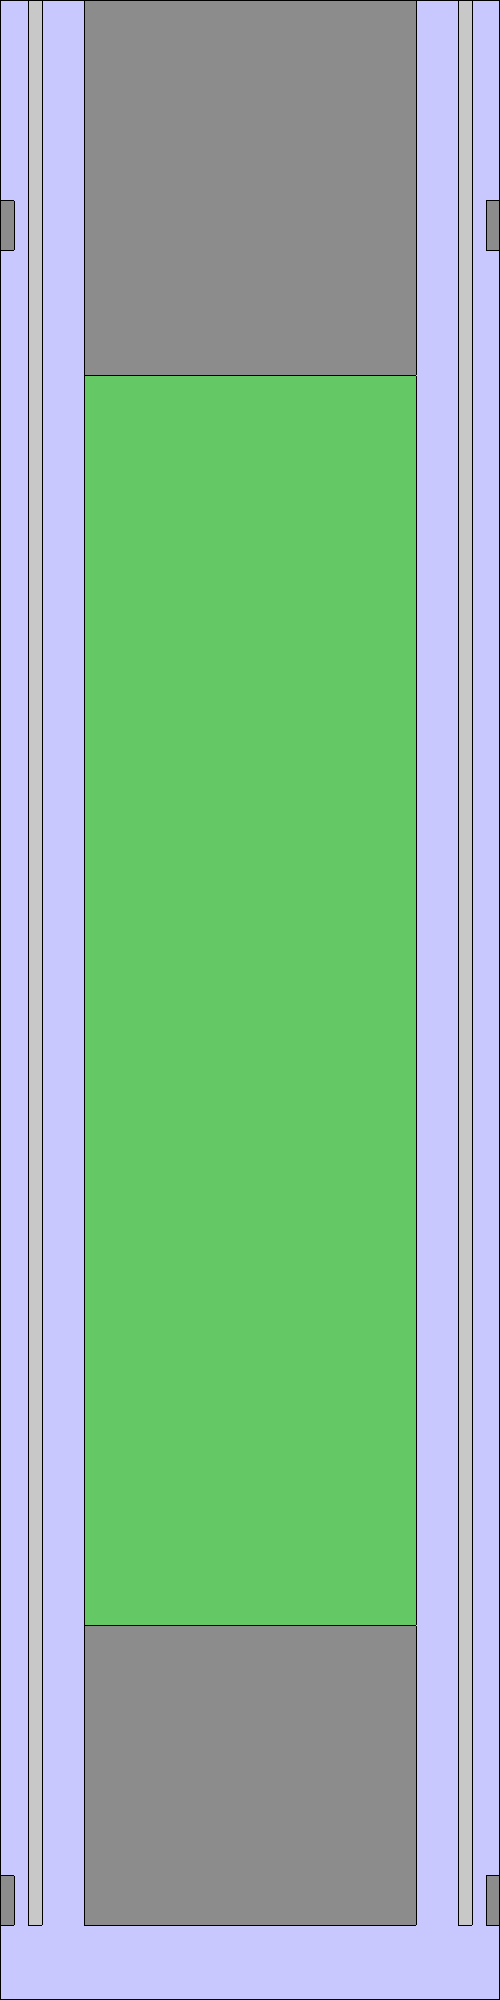
| 14:48, 14 September 2017 | TutorialReactorInsertedControlrodXZ.png (file) |  |
5 KB | Ville Valtavirta | xz-plot of the control rod and guide tube geometry model for the tutorial research reactor. Fully inserted. | 1 |
| 18:59, 24 February 2016 | Gcross1.png (file) |  |
5 KB | Jaakko Leppänen | 1 | |
| 22:30, 14 September 2017 | TutorialReactorStep9corexy.png (file) |  |
6 KB | Ville Valtavirta | XY-plot from the reactor core (level of axial midplane). | 1 |
First page |
Previous page |
Next page |
Last page |