File list
This special page shows all uploaded files.
First page |
Previous page |
Next page |
Last page |
| Date | Name | Thumbnail | Size | User | Description | Versions |
|---|---|---|---|---|---|---|
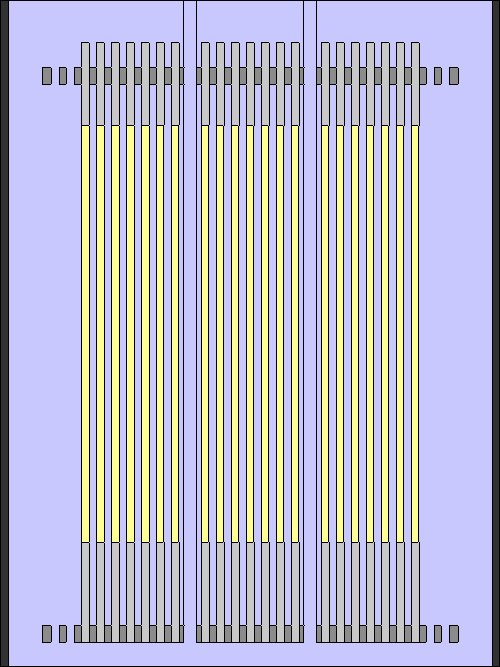
| 16:41, 4 October 2019 | VR Wwin1 geom1.png (file) |  |
8 KB | Jaakko Leppänen | 1 | |
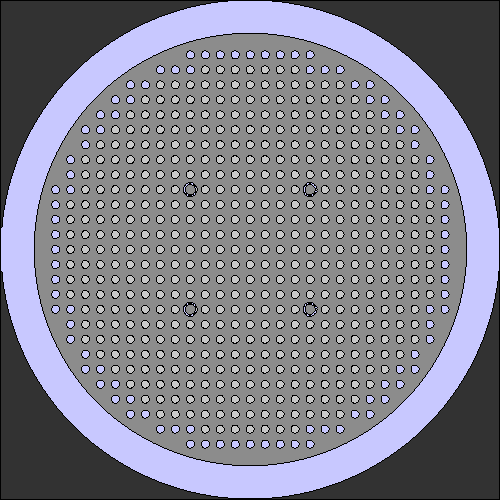
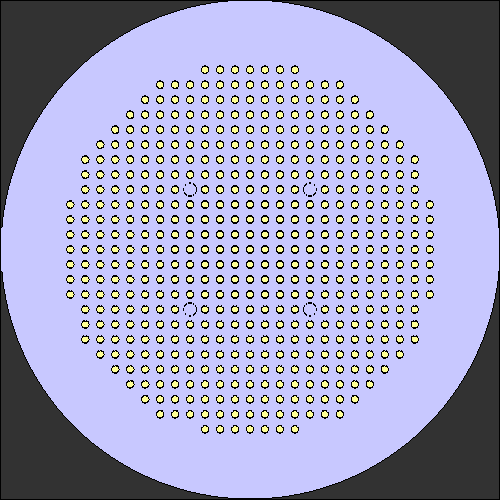
| 15:12, 4 October 2019 | VR Ref mesh1.png (file) |  |
20 KB | Jaakko Leppänen | 1 | |
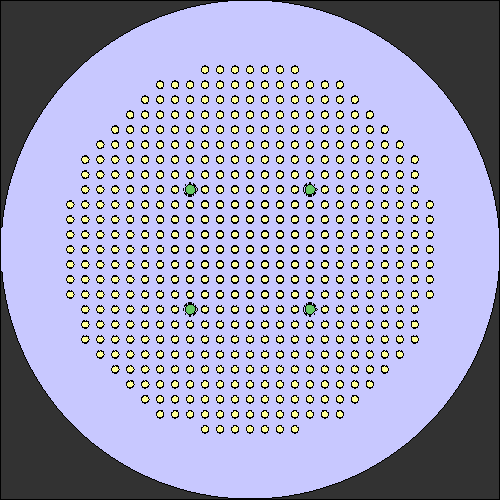
| 15:12, 4 October 2019 | VR Ref geom1.png (file) |  |
4 KB | Jaakko Leppänen | 1 | |
| 12:22, 16 May 2019 | Dd mode3.png (file) |  |
130 KB | Jaakko Leppänen | 1 | |
| 12:22, 16 May 2019 | Dd mode2.png (file) |  |
130 KB | Jaakko Leppänen | 1 | |
| 12:21, 16 May 2019 | Dd mode1.png (file) |  |
112 KB | Jaakko Leppänen | 1 | |
| 14:54, 4 March 2019 | Bunny1.png (file) |  |
137 KB | Jaakko Leppänen | 1 | |
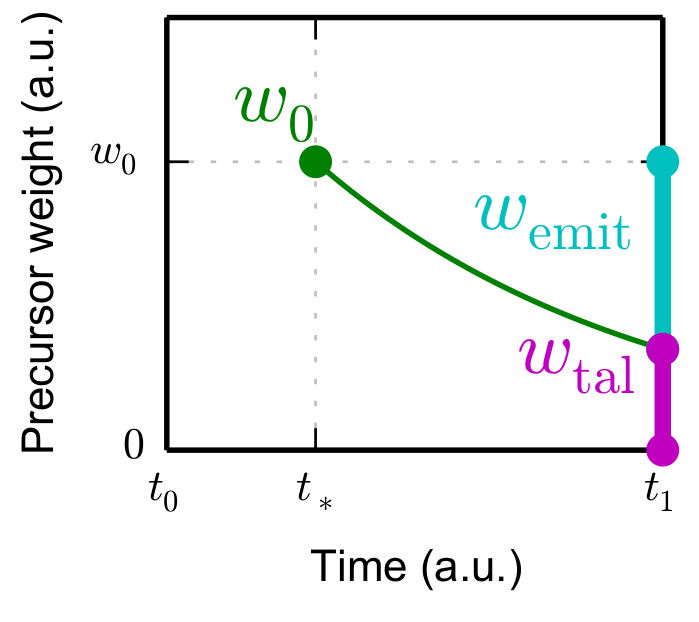
| 13:32, 14 November 2018 | PrecursorProductionDecayEmission.png (file) |  |
45 KB | Ville Valtavirta | A figure representing a single event of precursor production during a time-interval of a transient simulation. A part of the produced precursor weight decays before the end of the interval meaning that only a part of the produced weight is added to end... | 1 |
| 13:23, 14 November 2018 | PrecursorProductionDecayEmission.pdf (file) | 21 KB | Ville Valtavirta | A figure representing a single event of precursor production during a time-interval of a transient simulation. A part of the produced precursor weight decays before the end of the interval meaning that only a part of the produced weight is added to end... | 1 | |
| 12:34, 28 June 2018 | MSR NC.tar.gz (file) | 299 KB | Ville Valtavirta | Serpent input files for tank filled with molten salt with natural circulation based distributions. | 1 | |
| 19:40, 23 April 2018 | ValtavirtaDep.pdf (file) | 1.61 MB | Ville Valtavirta | Presentation in PHYSOR2018. | 1 | |
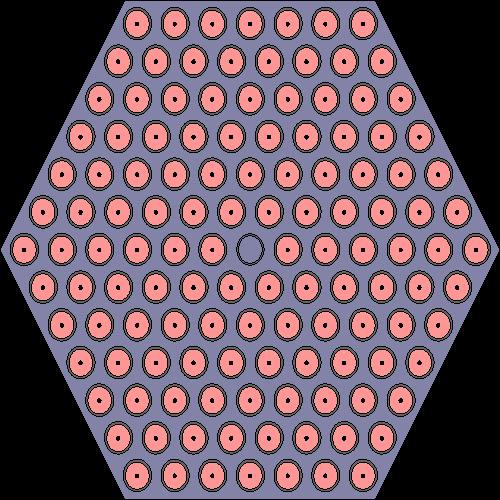
| 12:59, 8 March 2018 | HexIFC2 mesh4.png (file) |  |
14 KB | Ville Valtavirta | 1 | |
| 12:59, 8 March 2018 | HexIFC2 mesh3.png (file) |  |
89 KB | Ville Valtavirta | 1 | |
| 12:59, 8 March 2018 | HexIFC2 mesh2.png (file) |  |
141 KB | Ville Valtavirta | 1 | |
| 12:58, 8 March 2018 | HexIFC2 mesh1.png (file) |  |
174 KB | Ville Valtavirta | 1 | |
| 12:34, 8 March 2018 | HexIFC2 geom2.png (file) |  |
4 KB | Ville Valtavirta | 1 | |
| 12:34, 8 March 2018 | HexIFC2 geom1.png (file) |  |
9 KB | Ville Valtavirta | 1 | |
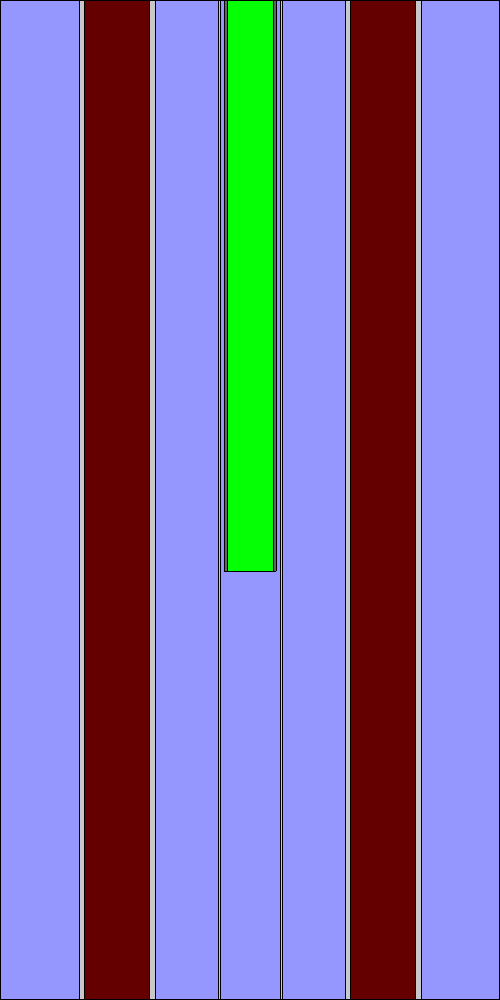
| 12:12, 3 November 2017 | CoupledTransientPlotXZ.png (file) | 7 KB | Ville Valtavirta | XZ-plot of the geometry of the coupled transient tutorial. | 1 | |
| 12:12, 3 November 2017 | CoupledTransientPlotXY.png (file) | 4 KB | Ville Valtavirta | XY-plot of the geometry of the coupled transient tutorial. | 1 | |
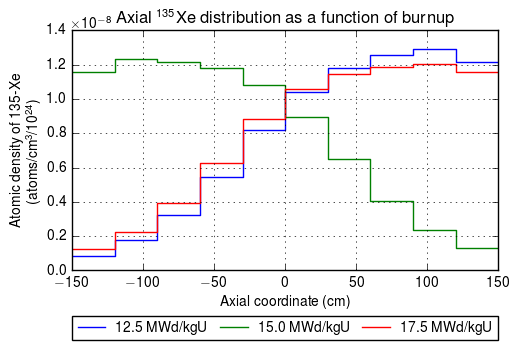
| 14:56, 29 September 2017 | UnstableCExenons.png (file) |  |
23 KB | Ville Valtavirta | Axial <sup>135</sup>Xe distribution of the 3D pin-cell, explicit Euler's method (constant extrapolation). | 1 |
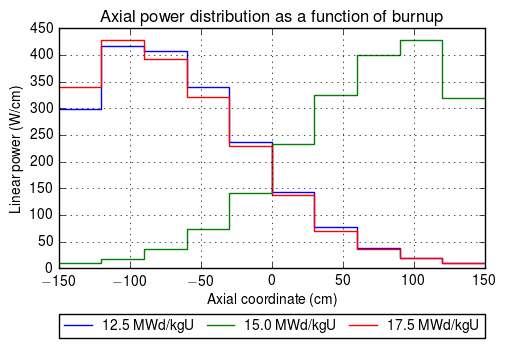
| 14:55, 29 September 2017 | UnstableCEpowers.png (file) |  |
22 KB | Ville Valtavirta | Axial power distribution of the 3D pin-cell, explicit Euler's method (constant extrapolation). | 1 |
| 14:13, 29 September 2017 | UnstableCEmeshAnimation.gif (file) |  |
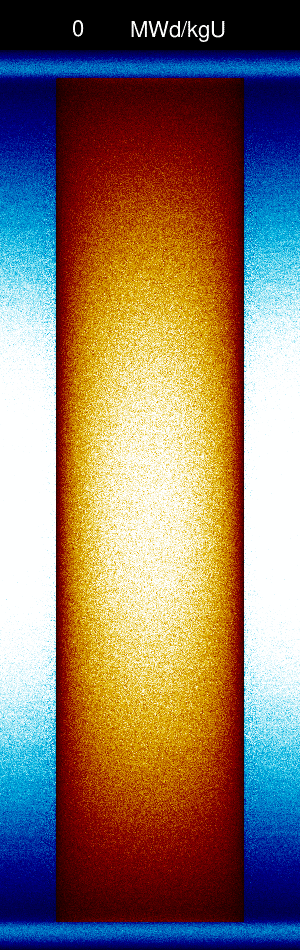
2.33 MB | Ville Valtavirta | Animation of the fission heat deposition and thermal flux in the unstable 3D system using explicit Euler's scheme for burnup (constant extrapolation pcc). | 1 |
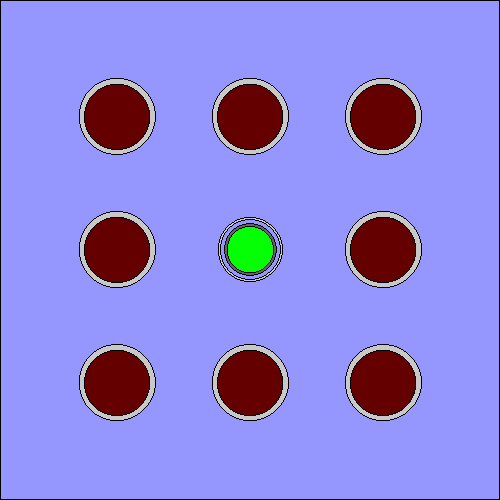
| 11:57, 29 September 2017 | Unstable3Dpin geom1.png (file) |  |
2 KB | Ville Valtavirta | XY-geometry plot of the pin-cell geometry used in the unstable 3D burnup problem. | 1 |
| 22:56, 14 September 2017 | TutorialReactorStep11xzCR.png (file) |  |
3 KB | Ville Valtavirta | XZ-plot from the reactor core (level of control rods). | 1 |
| 22:48, 14 September 2017 | TutorialReactorStep10xzCR.png (file) |  |
3 KB | Ville Valtavirta | XZ-plot from the reactor core (level of control rods). | 1 |
| 22:47, 14 September 2017 | TutorialReactorStep10corexy2.png (file) |  |
7 KB | Ville Valtavirta | XY-plot from the reactor core (level of lower grid). | 1 |
| 22:47, 14 September 2017 | TutorialReactorStep10corexy.png (file) |  |
6 KB | Ville Valtavirta | XY-plot from the reactor core (level of axial midplane). | 1 |
| 22:31, 14 September 2017 | TutorialReactorStep9xzCR.png (file) |  |
3 KB | Ville Valtavirta | XZ-plot from the reactor core (level of control rods). | 1 |
| 22:30, 14 September 2017 | TutorialReactorStep9corexy2.png (file) |  |
7 KB | Ville Valtavirta | XY-plot from the reactor core (level of lower grid). | 1 |
| 22:30, 14 September 2017 | TutorialReactorStep9corexy.png (file) |  |
6 KB | Ville Valtavirta | XY-plot from the reactor core (level of axial midplane). | 1 |
| 22:16, 14 September 2017 | TutorialReactorEmptyGuideTube.png (file) | 5 KB | Ville Valtavirta | XZ-plot for an empty guide tube in the reactor tutorial. | 1 | |
| 22:11, 14 September 2017 | TutorialReactorStep8corexy2.png (file) |  |
6 KB | Ville Valtavirta | XY-plot from the reactor core after plugging extra holes (level of lower grid). | 1 |
| 21:42, 14 September 2017 | TutorialReactorStep7corexy2.png (file) |  |
6 KB | Ville Valtavirta | XY-plot from the reactor core after adding empty positions (level of lower grid). | 1 |
| 21:41, 14 September 2017 | TutorialReactorStep7corexy.png (file) |  |
5 KB | Ville Valtavirta | XY-plot from the reactor core after adding empty positions (level of axial midplane). | 1 |
| 21:17, 14 September 2017 | TutorialReactorEmptyLatticePos.png (file) | 5 KB | Ville Valtavirta | XZ-plot for an empty lattice position in the reactor tutorial. | 1 | |
| 21:12, 14 September 2017 | TutorialReactorStep6xz.png (file) |  |
3 KB | Ville Valtavirta | XZ-plot from the reactor core. | 1 |
| 21:11, 14 September 2017 | TutorialReactorStep6corexy2.png (file) |  |
6 KB | Ville Valtavirta | XY-plot from the reactor core (level of lower grid). | 1 |
| 21:11, 14 September 2017 | TutorialReactorStep6corexy.png (file) |  |
6 KB | Ville Valtavirta | XY-plot from the reactor core (level of axial midplane). | 1 |
| 21:10, 14 September 2017 | TutorialReactorStep6xy.png (file) |  |
5 KB | Ville Valtavirta | XY-plot for the reactor input (level of axial midplane). | 1 |
| 20:59, 14 September 2017 | TutorialReactorStep5xz.png (file) |  |
3 KB | Ville Valtavirta | XZ-plot from the fuel rod lattice for the reactor input. | 1 |
| 20:58, 14 September 2017 | TutorialReactorStep5xy2.png (file) |  |
4 KB | Ville Valtavirta | XY-plot from the fuel rod lattice for the reactor input (level of lower grid). | 1 |
| 20:58, 14 September 2017 | TutorialReactorStep5xy.png (file) |  |
4 KB | Ville Valtavirta | XY-plot from the fuel rod lattice for the reactor input (level of axial midplane). | 1 |
| 18:14, 14 September 2017 | TutorialReactorStep4xz.png (file) |  |
1 KB | Ville Valtavirta | XZ-plot from the fuel rod model for the reactor input. | 1 |
| 18:13, 14 September 2017 | TutorialReactorStep4xy.png (file) |  |
2 KB | Ville Valtavirta | XY-plot from the fuel rod model for the reactor input. | 1 |
| 17:40, 14 September 2017 | TutorialReactorStep3xz.png (file) |  |
1 KB | Ville Valtavirta | XZ-plot from the reactor input with radial structure and axial limits. | 1 |
| 17:39, 14 September 2017 | TutorialReactorStep3xy.png (file) |  |
2 KB | Ville Valtavirta | XY-plot from the reactor input with radial structure and axial limits. | 1 |
| 17:27, 14 September 2017 | TutorialReactorStep2xz.png (file) |  |
1 KB | Ville Valtavirta | XZ-plot from the reactor input with radial structure. | 1 |
| 17:26, 14 September 2017 | TutorialReactorStep2xy.png (file) |  |
2 KB | Ville Valtavirta | XY-plot from the reactor input with radial structure. | 1 |
| 16:46, 14 September 2017 | TutorialReactorStep1.png (file) |  |
1 KB | Ville Valtavirta | Plot from the initial reactor input (infinite water geometry). | 1 |
| 14:50, 14 September 2017 | TutorialReactorWithdrawnControlrodXZ.png (file) |  |
5 KB | Ville Valtavirta | xz-plot of the control rod and guide tube geometry model for the tutorial research reactor. Fully withdrawn. | 1 |
First page |
Previous page |
Next page |
Last page |